| SP 500 | ||
|---|---|---|
| Current Stats 4-1-15 to 10-09-2020 | ||
| *(Fed Meetings / Announcement Dates may not always included due to volatility) | ||
| 102314 | Close >= ML 1 | 50 % |
| 167938 | Close >= Open | 81 % |
| 206598 | Total ML 1 | |
| 208621 | Total MS 1 | |
| 164694 | Close <= Open | 79 % |
| 98833 | Close <= MS1 | 47 % |
| 51740 | ML 1 Reversals | 25 % |
| 51740 | MS 1 Reversals | 25 % |
| Total Reversals | 14 % | |
| These numbers are calculated EOD | ||
Are you looking for an Edge?
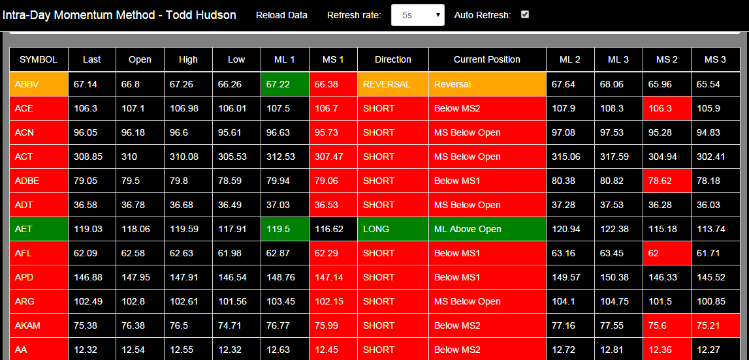
The Intra-Day Momentum Method is not a Trading System, but a guide to help traders determine intra-day direction. The Intra-Day Momentum Method points out price levels that have been historically significant. The Levels are labeled ML 1 for Momentum Long Level Up and MS 1 for Momentum Short Level Down. Once ML 1 Level has been reached, a stock will have closed above the Open over 70% of the time and above the ML1 Level 49% of the time. Once the MS 1 Level has been reached, a stock will have closed below the Open over 70% of the time and below the MS1 Level 47%. Actionable, scalable, timely research delivered to your web-browser everyday.
Does Trend Following give a trader an Edge?
Using The Intra-Day Momentum Method Model is expanded to three levels in each direction. Using the model to identify a trend, we calculate the probabilities of the next level being met. Our research suggests that if the high of the day is .01 higher than the ML1 Level, then the close of the day is at or above ML1 50% of the time, an increase of 1% over the 5 years studied. If the low of the day is less than the MS1 Level by .01, then the close of the day has been at or below the MS1 Level 48% of the time. This is an increase by 1% over the 5 years of data studied.
Would it help YOU to know which side of the Open a stock would likely Close on?
The following stats are the results from applying the approach to approximately 460 stocks in the S&P 500 from the dates shown in the graphic below. These stats are updated weekly (for non-subscribers) and are available for the prior week by Sunday evening. To view individual days, click on the Historical Results Tab or on each day individually below under Historical Results.
| SP 500 | ||
|---|---|---|
| Current Stats 4-1-15 to 10-09-2020 | ||
| *(Fed Meetings / Announcement Dates may not always included due to volatility) | ||
| 102314 | Close >= ML 1 | 50 % |
| 167938 | Close >= Open | 81 % |
| 206598 | Total ML 1 | |
| 208621 | Total MS 1 | |
| 164694 | Close <= Open | 79 % |
| 98833 | Close <= MS1 | 47 % |
| 51740 | ML 1 Reversals | 25 % |
| 51740 | MS 1 Reversals | 25 % |
| Total Reversals | 14 % | |
| These numbers are calculated EOD | ||
The Intra-Day Momentum Method
3-19-15 to 10-09-2020
ML 1 Stats
MS 1 Stats
Subscribe Today!!
Research
QAT Systems was founded on the principles of the very best traders that ever lived.
“To invest or speculate successfully, one must form an opinion as to what the next move of importance will be in a given stock."
"Speculation is nothing more than anticipating coming movements."
"In order to anticipate correctly, one must have a definite basis for that anticipation.”
- Jesse Livermore
Intra-Day Momentum Method
The Intra-day Momentum Method was designed to help determine the best way to trade a particular stock / ETF. The scientific approach focuses on determing Intra-Day Direction.
IDMM SP 500
The Intra-Day Momentum Method as applied to the SP 500
Subscriptions will be offered via Real-Time Web-based Applications
Articles
Determining Daily Intra-Day Direction - Is it Possible?
Determining Daily Intra-Day Direction - Is it possible? - TradingMarkets.com
Successful speculation starts with observation. Instead of looking at charts, I have designed a methodology for determining intra-day direction based on 'measured moves' and created applications to answer my questions regarding trade-able tendencies and to assist in my research.
How the Intra-Day Momentum Method can Help You Make Better Trading Decisions
How the Intra-Day Momentum Method can Help You Make Better Trading Decisions - TradingMarkets.com
The Intra-day Momentum Method was designed to help determine the best way to trade a particular stock / ETF, whether it is trend-following or reversion to the mean, in connection with a low-to-mid frequency intra-day trade.
Historical Results
The Intra-day Momentum Method was designed to help determine the best way to trade a particular stock / ETF, whether it is trend-following or reversion to the mean, in connection with a low-to-mid frequency intra-day trade. In order to determine which method had worked best over time, I created an algorithm that would find a measurement in price from the Open where the Close of the day had historically been above this level for Longs or below this level for Shorts approximately 50% of the time, for many stocks. *The ability of a stock to move plays an enormous role in this calculation. The ability to move is based on Price / Pattern / Volume. Stocks that do not move, will not likely close above / below the levels 50% of the time. While this is by no means perfect, it certainly gives a trader a method for selecting stocks and entry points that have a reasonable chance for success. The Method was developed to adapt to market changes rather quickly as it takes into account price-action, patterns, and volume. On the link below, you will find the results from the most recent update from a list of 460 stocks from the S & P 500.
Applications
Web-based applications have been developed to deliver the Intra-Day Momentum Method in Real-Time.
Real-Time Web Based Applications
Real-Time Signals
View the Intra-Day Momentum Method in Real-Time, using a Proprietary web-based application that signals when stocks have crossed the levels.
Contact
QAT Systems
919.539.1915
To inquire about our Scientific Approach to trading email us at todd.hudson@qatsystems.com.
this is a test #1