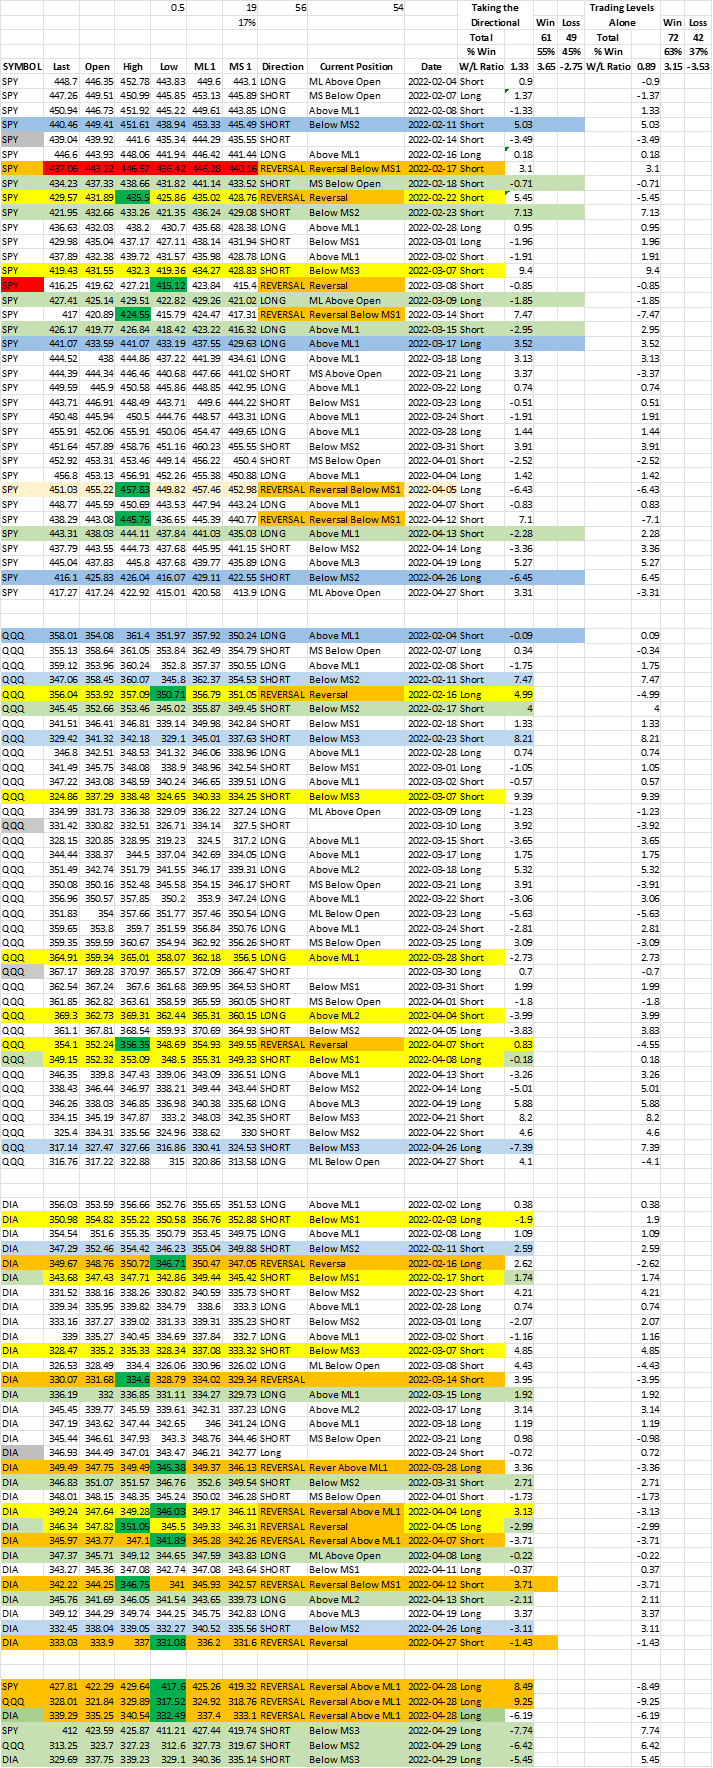
The goal of this research is to determine if applying a short-term directional indicator would increase the accuracy of The Intra-Day Momentum Method(IDMM) levels. We will examine the results for three ETFs over the past three months. The ETFs we will examine are the SPY, DIA, and QQQ. While there are many different ways to determine the short-term trend, we will look at three ways to define it. This article will focus on a single approach. Additional articles will focus on the others. In this research, we are not seeking out patterns to indicate a change in direction. As a result, this approach will fail during the phase where the markets change short-term direction. In the coming weeks, I will be demonstrating how patterns can help determine short-term market direction change. The results for this research are displayed in the image below.
First, we want to see what we are working with. Over the past three months (February – April 2022) I have applied the IDMM to the SPY, DIA, and QQQ. We will look at the results of applying the model to these ETFs. Most importantly, we want to answer the following questions about the method:
- What percentage of the time does the ETF close at or above the ML1 level? What percentage of the time does the ETF close at or below the MS1 level?
- Simulate a trade at the levels (ML1/MS1) and close out the position at the end of the day? Calculate the results without any sort of risk management.
- Determine percent profitable, win/loss ratio.


As Is – Applying the Method
My research shows that if you traded the levels as they are, for the past three months, the results are as follows:
The SPY, DIA, and QQQ closed in the direction of the Level 64.% of the time. This means 64% of the time either level was met ML1/MS1, the market closed at or above the ML1 or at or below the MS1. This was considerably greater than what I would have expected. I usually test all of my techniques using no stop-loss or risk management. This means that I enter a trade (simulate) at the levels (ML1/MS1) with an exit at the close of the day. What this means is that you would be in every single reversal on the WRONG side of the trade. I try to demonstrate a worst-case-scenario, from the start. I do this so that the strength and scalability of the The Intra-Day Momentum Method can be observed.
Applying a Trend-Following Filter
With the first trend following filter, regardless of the direction of the intra-day levels the performance was less effective from a percentage standpoint. The levels were successful 54% of the time. This was regardless of which level was met. In this scenario, I simulated entering a Long position if the short-term trend indicator was Up. I simulated entering a Short position if the short-term indicator was Down. Using this trend-following approach, the directional filter did not improve the success of the levels.
However, it would have performed much better in regards to the Win/Loss ratio. As the average win was about 50% more in this example than in the example that did not filter for the short-term trend. This is very crucial in trading as many traders would like to see their average win greater than their average loss. That being said, remember, there is absolutely no risk management being used in this research.
This research was conducted based on levels being reached intra-day. There were no other conditions. All fast moves were included. As well, calculations that have demonstrated improved performance of The Intra-Day Momentum Method levels were not performed in this research. Such as the following calculation: Searching for Higher Probability Intra-Day Methods.
Conclusion
In this research, I found that filtering for the short-term trend in this instance did not increase the success of the levels. However, it did demonstrate improved performance in reducing risk. This shows up in the research by increasing the Win/Loss Ratio.
In order to increase the performance of this approach, we suggest the following improvements. Filter for specific price patterns, such as expansions and contractions. Define overbought and oversold conditions. These improvements are likely to enhance the Intra-Day Momentum Method levels.
This research will continue. There will be monthly updates to this work in progress. I will continue this discussion by demonstrating that filtering for certain patterns would likely increase the results. Many of these particular patterns do not repeat often. I will then demonstrate the affect of having a confirmation of the short-term trend combined with reaching the level intra-day. confirming the direction. This will be done for at least three different ways of defining the short-term trend. The goal is to combine all of these concepts to develop a high probability low-risk approach to the intra-day markets.
